Visualizing K-Means Clustering tutorial
Source Code Link: K-Means example
More on K-Means at: Tech In Deep
Introducing K-Means
K-Means is an algorithm that is used in a situation where you are given a dataset where each sample has a set of features, but no labels. In a situation like this we can try and find groups of data, which are similar to one another. Similar data points would stay close to each other. This way they create groups, or as we call it clusters.
K-Means is a clustering algorithm. Because K-Means makes inferences from dataset using only input vectors, without referring to known, or labeled samples, it makes it an unsupervised learning algorithm.
The goal when using K-Means is simple. Given a dataset, group similar data points together and discover underlying patterns.
In order to define the clusters K-Means uses centroids. Centroids are points that are used to describe the cluster. That way a point is considered to be in a particular cluster, is if it is closer to that cluster’s centroid than any other centroid.
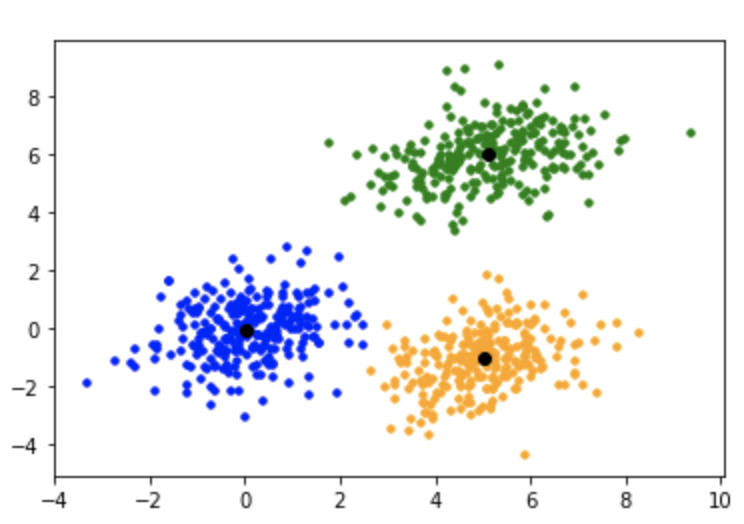
On the image above we have three clusters of points (green, blue and yellow). Each cluster is described by one centroid (black point).
Visualizing K-Means Clustering
First we choose the number of clusters “K” (the number of groups we want to find in the data). Then the centroids are initialized at random. Once the centroids are initialized we are ready to do the first iteration.
The iteration consists of two steps. Firstly, we assign each point to a cluster whose centroid is nearest to it. In the second step, we calculate the centroid’s location as the mean (center) of all the points assigned to its cluster. And that’s it. We are repeating these two steps until the centroids stop moving, or no new data points are assigned to any cluster.
K-Means in action
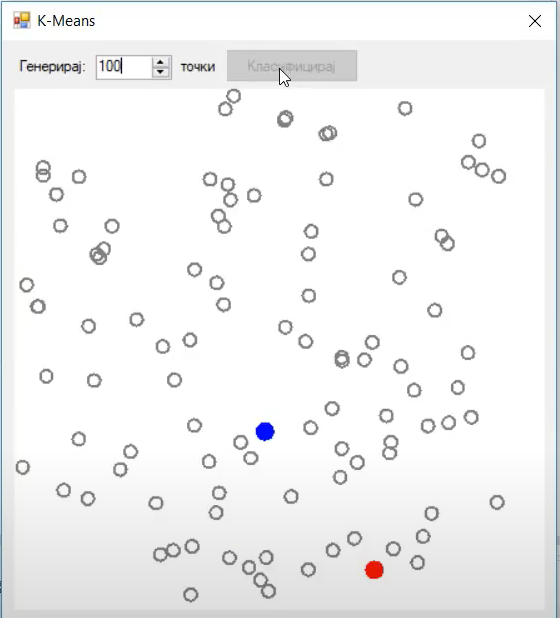
In this image we see the two centroids (blue and red), as well as out data points (grey). The data points are grey because they do not belong to any cluster at the moment.
The important part you need to note is the initial centroid initialization. The value K (number of clusters) is two. One centroid is blue the other is red in color. In the first step, we are initializing them at a random location. At this point we are not assigning any data points to the clusters, we are just initializing the centroids.
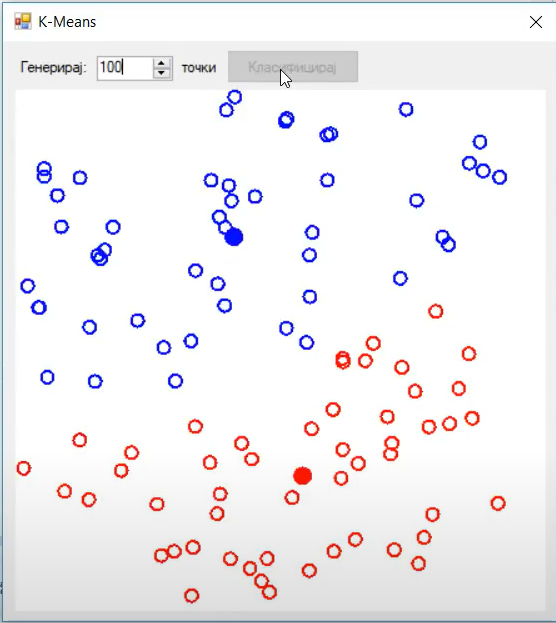
Now we are ready to do the two step iteration. Firstly, we are assigning all data points to the closest cluster. The data points closest to the blue centroid are blue. Similarly, data points closest to the red centroid are red
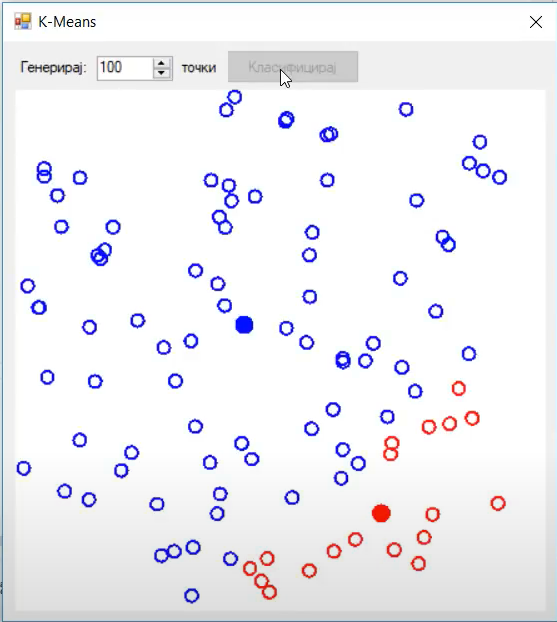
After that, the second step is calculating the centroid position. In this example we are calculating the mean distance of all points belonging to that cluster.
Here are a couple of more examples:
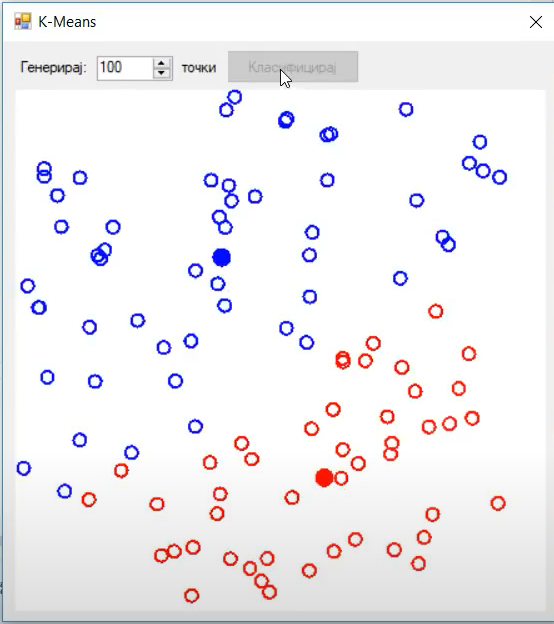
The best way to visualize and learn about K-Means is to watch the video and debug the code.
