Shape Recognition/Grouping using K-Means
Source Code Link: Shape Recognition using Histograms
Hey guys,
So this time we are going to try and recognize an object based on a very basic histogram analysis.
Programming Language:
- C#
What Third Party Libraries are we going to be using?
- None
Who is this article for?
- A developer who wants to learn how to solve a simple shape recognition problem. This is only part 1. We will build up on this project with more advanced stuff pretty soon. But let’s learn the basics first.
Additional Questions:
- Please post all your questions in the comment section. You may never know who you are helping also. Sharing is caring…
Workflow:
- Process the image (RGB->Grayscale->B&W)
- Generate Vertical and Horizontal histograms
- Process the histograms
- Extract shape features from the histograms
- Train KMeans classifier to group the shapes based on their features
Image Processing for Shape Recognition
First we have to do some image processing. As stated in the workflow we have to convert the image from RGB to Grayscale then to Black&White image. So what’s the point there? Well we are trying to recognize a shape. That means that the color of that shape is not important for this particular task. The circle can be green, black, red… it doesn’t matter. So we are getting rid of the color.
After we remove the color dimension, we end up having a Grayscale image. At this moment we can also use a grayscale image as well. But for the dataset we have at the moment, it makes sense to simplify our feature extraction and convert the grayscale image to a black and white one. We will see in the more advanced tutorial how to work with grayscale images and extracting visual shape features using convolution. But for now we will stick to a very simple B&W image. That should be perfectly fine as long as the shape features are clearly visible. There are many ways to convert RGB image to Grayscale one and from Grayscale to B&W, but for now I do encourage you to use a very minimal and basic solution to this problem.
You can use third party libraries for this part like Accord.NET or AForge.NET. They have methods that you can use to do all those image manipulation procedures.
Accord.NET Example:
You can find the Accord library at: http://accord-framework.net/
Grayscale filter = new Grayscale( 0.2125, 0.7154, 0.0721 );
Bitmap grayImage = filter.Apply( image );

Now since we want a B&W image we can use one more code snippet from Accord.NET
Threshold filter = new Threshold(100);
filter.ApplyInPlace( image );
You can use Threshold class for B&W conversion, but when setting up the threshold manually make sure that the shape features are clearly visible. If they are not use another threshold.
Now since we have processed the image, let’s move on to the next step of the workflow…
Before you continue you may like to check AForge
Generate Vertical and Horizontal histograms
Because we are not going to extract visual features using convolution, we are going to instead use the histogram to do that. We’ll get into convolution and neural networks into later articles. The idea I am trying to convey here, is that there are many ways to solve a problem. And you always have to think into patterns. Usually we (developers) think in terms of algorithms, but this article should provide us with a lot of reasons as to why we have to get out of that type of thinking. I bet that you will think of another solution to this problem by the end of this article…
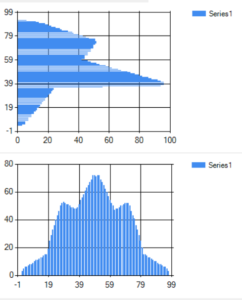
The vertical and horizontal histograms describe the distribution of the black pixels over the image. Once we have our histogram, we need to think what uniquely describes the shapes on those histogram images. So remember, a histogram currently is the distribution on the black pixels over our image. Very simple, very basic…
So here is the vertical and horizontal histogram for the star shape.

If you want to do this using Accord.NET library or AForge search for the following classes:
Getting the histogram is as easy as:
VerticalIntensityStatistics vis = new VerticalIntensityStatistics(sourceImage);
Histogram histogram = vis.Gray;
Process the histograms
Now why do we need to additionally process the histograms? Well the shapes can be placed anywhere in the image. Also they can vary in size. So what we are going to do is clip the starting point and ending point on the histograms that do not contain any number of black pixels.
Extract Shape Features from the histograms for Shape Recognition
Now the fun part starts. This is where you look at the histogram and decide what is unique about every shape. It can be anything. You can use something as easy as average number of pixels, min/max number of pixel at a certain point, anything you think, that would uniquely describe the shape. You can use simple stuff, or maybe even more complex math functions, like measuring the asymmetry on the histogram. Your choice…
Mine is described in the code bellow… I encourage You to try different features and see what kind results you get.
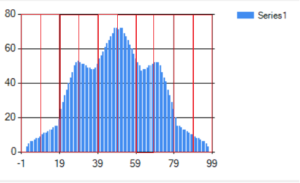
First I split the histogram into 10 parts. Something like this:

For each part I extract two types of features:
- Extract the MAX and the AVG values for that particular part -> 2 scalars
- I measure how many times the histogram goes up, down or stays the same -> 3 scalars
So in total for one part of the histogram I have 5 scalars. Multiply that by 10 and you will get 50 scalars for one histogram. For both, horizontal and vertical you will get 100 scalars, that you are going to put into a 1D vector. That vector is the input to your dataset.
Let’s move on to the next part…
Shape Recognition using KMeans algorithm
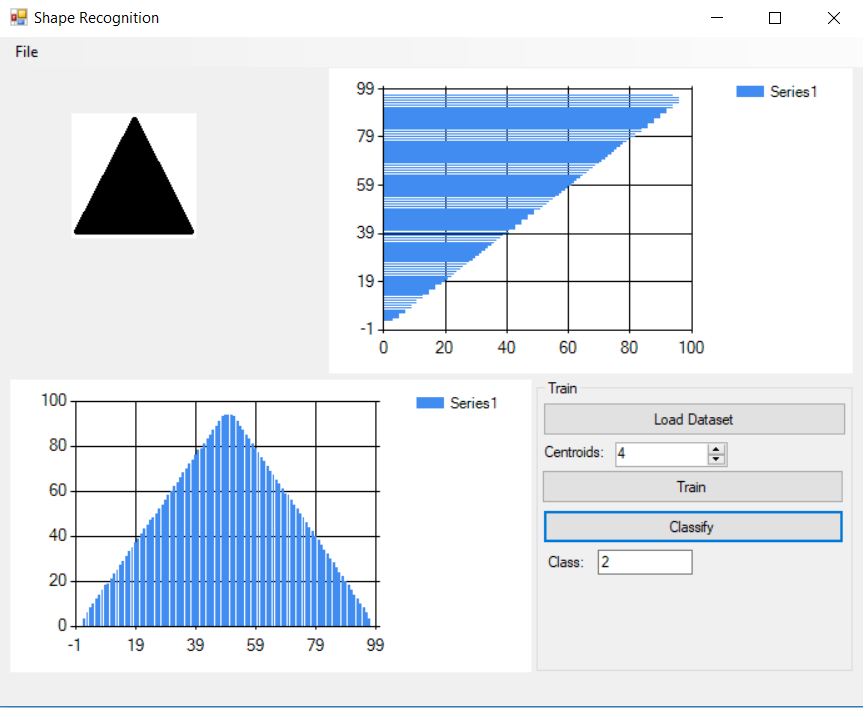
Like we already stated we have a 1D vector consisting of 100 scalars describing a shape. Now we iterate over the images and process them all (create a matrix with the following dimensions: number_of_images x 100). This 2D matrix is our dataset. We already have previous projects and articles on KMeans, so we are not going to repeat what it does. To summon it all up: It will find centroids describing the clusters found in our dataset. What we are hoping for is that similar shapes would form a cluster. KMeans will assign a centroid to that cluster and will be able to recognize/classify the shape under the correct centroid. This is where engineering good descriptive features comes into place. The more a certain feature is expressed in our dataset the better KMeans will perform.
Happy Coding guys…
